The figure below shows the demand (D) and supply (S) curves of cocoa in the U.S. Figure 20.4 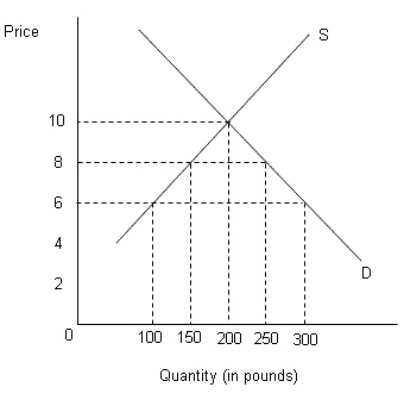 From Figure 20.4, determine the total volume of U.S.cocoa imports if its government imposes tariff at the rate of $2 per pound on cocoa.
A) 200 pounds
B) 250 pounds
C) 100 pounds
D) 300 pounds
E) 350 pounds
Correct Answer:
Verified
Q60: The figure given below depicts the negatively
Q62: The figure below shows the demand (D)
Q63: The figure below shows the demand (D)
Q63: As a result of the government procurement
Q64: The figure below shows the demand (D)and
Q66: Suppose,in the United States,each farmer is given
Q68: The figure below shows the demand (D)and
Q74: The basic difference between a tariff and
Q78: A customs union is an organization of
Q79: In 1992 the EEC was replaced by
Unlock this Answer For Free Now!
View this answer and more for free by performing one of the following actions

Scan the QR code to install the App and get 2 free unlocks

Unlock quizzes for free by uploading documents