The below figure shows the various combinations of the goods X and Y that yield different levels of utility. Figure 6.3 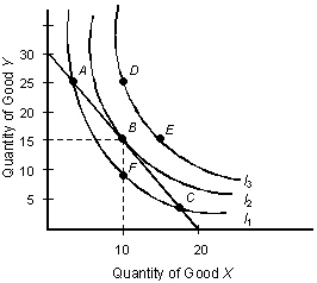 In Figure 6.3, if the price of one unit of good X and good Y is $30 and $20, respectively, the consumer's income is _____.
A) $50
B) $150
C) $400
D) $600
E) $900
Correct Answer:
Verified
Q81: The table below shows the total utility
Q93: The table below shows the total utility
Q95: The figure given below represents two indifference
Q98: The below figure shows the various combinations
Q99: The below figure shows the various combinations
Q114: The below figure shows the various combinations
Q118: The below figure shows the various combinations
Q119: The below figure shows the various combinations
Q121: The below figure shows the various combinations
Q128: If a consumer is buying only goods
Unlock this Answer For Free Now!
View this answer and more for free by performing one of the following actions

Scan the QR code to install the App and get 2 free unlocks

Unlock quizzes for free by uploading documents