The below figure shows the various combinations of the goods X and Y that yield different levels of utility. Figure 6.3 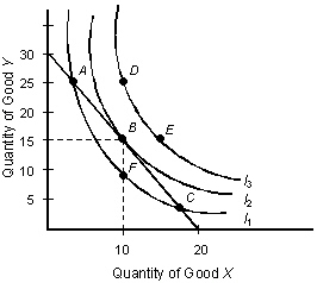 Refer to Figure 6.3.What combinations of X and Y are attainable by the consumer?
A) All combinations that lie on or above I2
B) All combinations that lie above I1
C) All combinations that lie below I3
D) All combinations that lie on or below the budget line.
E) Only the combination of 10 units of good X and 15 units of good Y
Correct Answer:
Verified
Q83: The table below shows the total utility
Q84: The table below shows the total utility
Q86: The below indifference map shows the various
Q87: The table below shows the total utility
Q89: The below indifference map shows the various
Q92: An indifference curve shows _.
A)the relationship between
Q96: The table below shows the total utility
Q105: The below indifference map shows the various
Q109: The below indifference map shows the various
Q117: When the budget line is just tangent
Unlock this Answer For Free Now!
View this answer and more for free by performing one of the following actions

Scan the QR code to install the App and get 2 free unlocks

Unlock quizzes for free by uploading documents