The figure given below shows the import demand and export supply curves of corn of the U.S.and Mexico. Figure 20.2 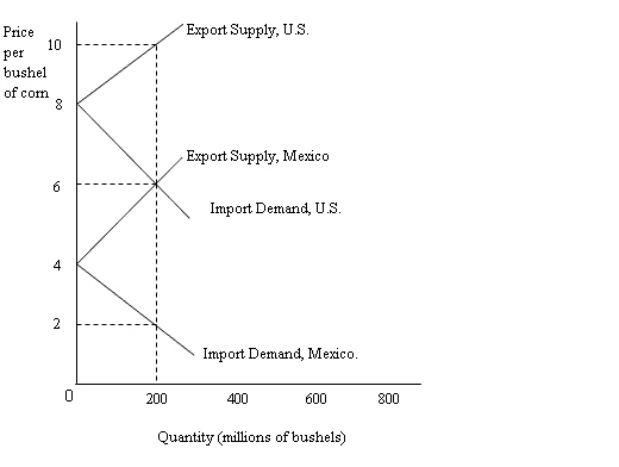 Refer to Figure 20.2.The no-trade equilibrium price of corn in the U.S.is:
A) $2.
B) $4.
C) $6.
D) $8.
E) $10.
Correct Answer:
Verified
Q41: The first panel in the following figure
Q46: If the world price of steel is
Q59: The first panel in the following figure
Q61: The theory that explains the shift of
Q61: The figure given below shows the import
Q61: The table below shows the quantity demanded
Q62: The table below shows the quantity demanded
Q68: The figure given below shows the import
Q69: The product life cycle theory of comparative
Q78: Differences in the productivity of labor account
Unlock this Answer For Free Now!
View this answer and more for free by performing one of the following actions

Scan the QR code to install the App and get 2 free unlocks

Unlock quizzes for free by uploading documents