The figure given below shows the demand curves for dollars arising out of Thai demand for U.S.goods and services and the supply of dollars arising out of the U.S.demand for Thai goods, services, and financial assets.D1 and S1 are the original demand and supply curves. Figure 18.2 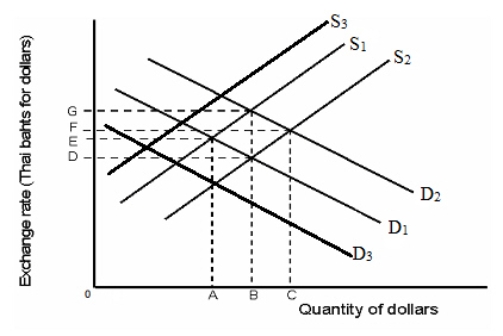 Refer to Figure 18.2.Suppose investors predict that the value of Thai assets will decrease in the near future.This affects the current equilibrium exchange rate.To restore the original equilibrium, the Thai government intervenes in the foreign exchange market.How will this government action appear on the graph?
A) As a shift in the demand curve from D2 to D1
B) As a shift in the demand curve from D1 to D3
C) As a shift in the supply curve from S1 to S3
D) As a shift in the supply curve from S1 to S2
E) As a shift in the demand curve from D2 to D3
Correct Answer:
Verified
Q55: The financial crisis of 2007-2008 illustrated how
Q56: To counteract the depreciation of national currency
Q57: What is a speculative attack on a
Q58: Generally, which of the following is the
Q59: As the Asian financial crisis of 1997
Q61: Globalization does not reward countries that follow
Q62: The phrase "race to the bottom" refers
Q63: An overall decline in communication and transportation
Q64: It has been proved empirically that globalization
Q65: Supporters of globalization believe that free trade
Unlock this Answer For Free Now!
View this answer and more for free by performing one of the following actions

Scan the QR code to install the App and get 2 free unlocks

Unlock quizzes for free by uploading documents