The figure given below represents demand for and supply of hospital beds in Anytown, U.S.A. , as shown by curves D and S1 in the following figure.If the hospital receives permission to expand, its new supply curve will be S2.Price level P1 is the fixed prospective payment reimbursement rate paid by Medicare to the hospital, regardless of actual cost. Figure 18.3 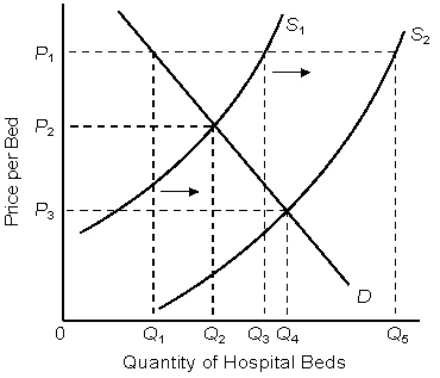 According to Figure 18.3, given the existing demand for its beds, after the hospital completes its expansion it will maximize its occupancy rate by charging a price level:
A) P1.
B) P2.
C) P3.
D) (P1+ P2) /2.
E) P3-P1.
Correct Answer:
Verified
Q22: Which of the following can increase the
Q26: The American Medical Association helps increase:
A)price competition
Q28: The increase in physicians' fees in the
Q32: Which of the following statements about Medicare
Q34: The high cost of hospital care in
Q43: The following figure shows the demand (D)and
Q43: A physician who prescribes unnecessary tests to
Q44: The following figure shows the demand (D)and
Q45: The figure below shows the demand (AD)and
Q53: Which of the following reasons justifies the
Unlock this Answer For Free Now!
View this answer and more for free by performing one of the following actions

Scan the QR code to install the App and get 2 free unlocks

Unlock quizzes for free by uploading documents