The following figure shows the demand (D) and supply (S) curves of human organs Figure 18.5 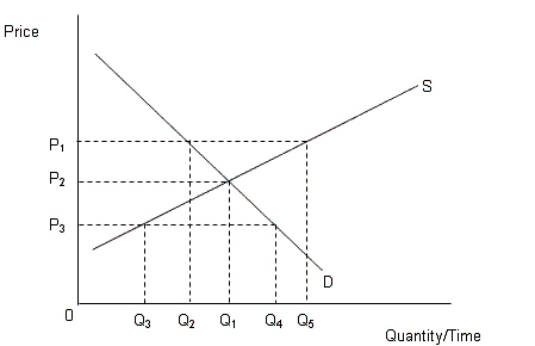 In Figure 18.5, if the price for human organs falls to P3:
A) there will be a surplus of human organs by Q5 - Q2.
B) there will be a shortage of human organs by Q4 - Q3.
C) there will be a shortage of human organs by Q5 - Q3.
D) there will be a surplus of human organs by Q4 - Q3.
E) there will be a shortage of human organs by Q5 - Q1.
Correct Answer:
Verified
Q22: Which of the following can increase the
Q32: Which of the following statements about Medicare
Q41: The figure given below represents demand for
Q41: Why are black markets for human organs
Q43: The following figure shows the demand (D)and
Q43: A physician who prescribes unnecessary tests to
Q45: The figure below shows the demand (AD)and
Q47: Why is health care considered to be
Q50: People who oppose the establishment of an
Q53: Which of the following reasons justifies the
Unlock this Answer For Free Now!
View this answer and more for free by performing one of the following actions

Scan the QR code to install the App and get 2 free unlocks

Unlock quizzes for free by uploading documents