The figure below shows the supply curve for labor. Figure 15.1 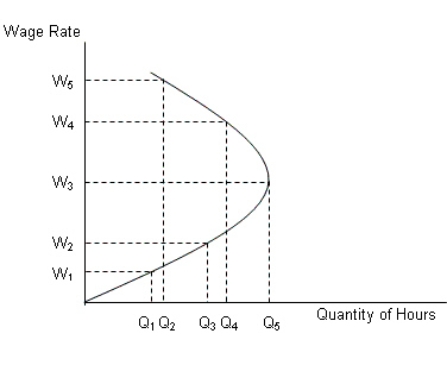 Refer to Figure 15.1.When wage rate increases from W2 to W3 :
A) quantity of labor supplied increases from Q1 to Q4.
B) quantity of labor supplied decreases from Q3 to Q4.
C) quantity of labor supplied increases from Q4 to Q5.
D) quantity of labor supplied increases from Q2 to Q4.
E) quantity of labor supplied increases from Q3 to Q5.
Correct Answer:
Verified
Q9: The labor demand curve is based on
Q11: It is said that a wage increase
Q12: Why does the labor market have more
Q18: The figures given below show the demand
Q19: The figure given below shows the demand
Q22: The following figures show the demand and
Q24: Minimum wage legislation by the government would:
A)create
Q27: Why has the inequality of income become
Q30: An individual is induced to change his/her
Q32: Investment in human capital implies:
A)investment on machines,technological
Unlock this Answer For Free Now!
View this answer and more for free by performing one of the following actions

Scan the QR code to install the App and get 2 free unlocks

Unlock quizzes for free by uploading documents