The following figure represents the equilibrium in the labor markets. Figure 14.4 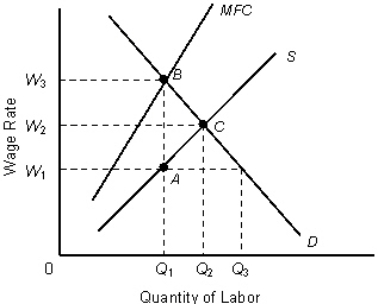 In the figure,
MFC: Marginal Factor Cost curve
D: Demand or the Marginal Revenue Product curve
S: Supply curve
Refer to Figure 14.4.A monopsonist will pay the wage rate _____ and hire _____ units of labor.
A) W2;Q2
B) W1;Q2
C) W3;Q1
D) W1;Q3
E) W1;Q1
Correct Answer:
Verified
Q41: The following table shows total output produced
Q50: The following figure represents the equilibrium in
Q52: The following table shows total output produced
Q53: The following figure represents the equilibrium in
Q54: The following table shows the marginal productivity
Q55: The following table shows the marginal revenue
Q58: The figure given below represents equilibrium in
Q60: The figure given below represents equilibrium in
Q66: Why is the value of marginal product
Q70: The figure given below represents equilibrium in
Unlock this Answer For Free Now!
View this answer and more for free by performing one of the following actions

Scan the QR code to install the App and get 2 free unlocks

Unlock quizzes for free by uploading documents