The figure given below shows the Phillips curves of the U.S.economy during early 1960s to late 1970s. Figure 14.2 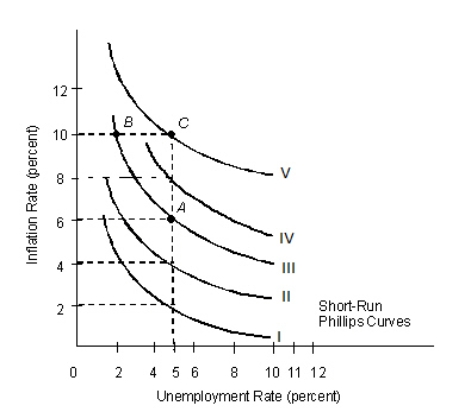 Refer to Figure 14.2.If the natural rate of unemployment is 5 percent, which of the following would cause a movement along Phillips curve III from point A to point B?
A) An inward shift of the aggregate demand curve
B) An outward shift of the aggregate demand curve
C) A movement down along the aggregate supply curve
D) A movement down along the aggregate demand curve
E) A movement up along the aggregate demand curve
Correct Answer:
Verified
Q15: Contrary to what believers in the Phillips
Q16: The long-run Phillips curve indicates that the
Q17: In the short run, a decline in
Q18: The Phillips curve based on the unemployment
Q19: The natural rate of unemployment is defined
Q21: Following an unexpected decline in aggregate demand,
Q22: The adaptive expectations theory suggests that:
A)the price
Q23: When aggregate demand declines unexpectedly and wage
Q24: The actual rate of inflation is equal
Q25: A look at macroeconomic data across countries
Unlock this Answer For Free Now!
View this answer and more for free by performing one of the following actions

Scan the QR code to install the App and get 2 free unlocks

Unlock quizzes for free by uploading documents