The figure given below represents the short run and long run Phillips curve. Figure 14.4 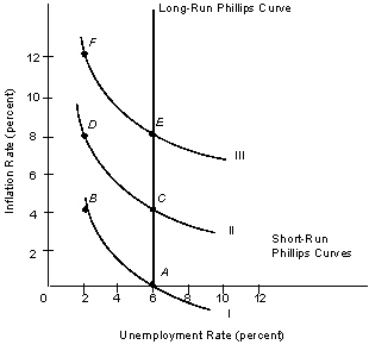 Refer to Figure 14.4.If the adaptive expectations hypothesis holds, and the economy moves from point C to point D because of expansionary fiscal policy, what rate of inflation are people expecting at point D?
A) 2 percent
B) 4 percent
C) 6 percent
D) 8 percent
E) 10 percent
Correct Answer:
Verified
Q47: If the public expects the incumbent administration
Q48: Critics of the Federal Reserve maintain that,
Q49: A sudden technological breakthrough in an economy
Q50: The business cycle that results from the
Q51: Suppose workers do not believe the Fed
Q53: Consider an economy in equilibrium, and assume
Q54: To some economists, the "great moderation" means:
A)small
Q55: A time-inconsistent monetary policy is one that:
A)is
Q56: Suppose that the Fed announces a low-money-growth
Q57: Which of the following will be a
Unlock this Answer For Free Now!
View this answer and more for free by performing one of the following actions

Scan the QR code to install the App and get 2 free unlocks

Unlock quizzes for free by uploading documents