The figure given below represents the short run and long run Phillips curve. Figure 14.4 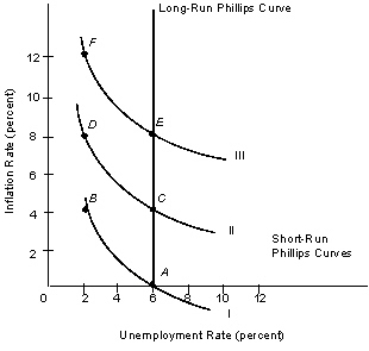 Refer to Figure 14.4.A movement from point A to point C would be associated with an:
A) outward shift of both the aggregate demand and the aggregate supply curve.
B) outward shift of the aggregate supply curve and an inward shift of the aggregate demand curve.
C) outward shift of the aggregate demand curve and an inward shift of the aggregate supply curve.
D) outward shift of the aggregate demand curve but no change in the aggregate supply curve.
E) inward shift of both the aggregate demand and the aggregate supply curve
Correct Answer:
Verified
Q55: A time-inconsistent monetary policy is one that:
A)is
Q56: Suppose that the Fed announces a low-money-growth
Q57: Which of the following will be a
Q58: Which of the following would not be
Q59: Which of the following shifts the aggregate
Q61: U.S.economic data from 1955 to 2000 show
Q62: Hyperinflation in developing countries is typically the
Q63: When the money supply increases by $5
Q64: Monetary reform is a new monetary policy
Q65: In the presence of Regulation Q, when
Unlock this Answer For Free Now!
View this answer and more for free by performing one of the following actions

Scan the QR code to install the App and get 2 free unlocks

Unlock quizzes for free by uploading documents