The figure given below depicts the equilibrium in the foreign exchange market. Figure 13.1 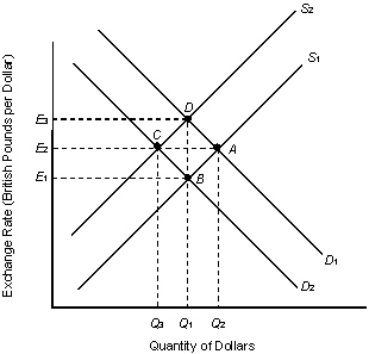 Refer to Figure 13.1.Which of the following is most likely to cause equilibrium to change from point A to point D?
A) A decrease in U.S.demand for British goods and services
B) An increase in U.S.demand for British goods and services
C) An increase in the supply of dollars on the foreign exchange market
D) A decrease in the supply of British pounds on the foreign exchange market
E) An increase in British demand for U.S.exports
Correct Answer:
Verified
Q74: When more than one central bank attempts
Q75: The supply curve of U.S.dollars in the
Q76: The figure given below depicts the equilibrium
Q77: If the U.S.dollar depreciates against the yen
Q78: To fix the foreign currency price of
Q80: The figure given below depicts the equilibrium
Q81: Suppose a bond sells for $2, 000
Q82: The transactions demand for money exists because:
A)people
Q83: If a bond pays a fixed return
Q84: A change in the interest rate does
Unlock this Answer For Free Now!
View this answer and more for free by performing one of the following actions

Scan the QR code to install the App and get 2 free unlocks

Unlock quizzes for free by uploading documents