The figure given below depicts the equilibrium exchange rate between the U.S dollar and the Mexican peso. Figure 13.2 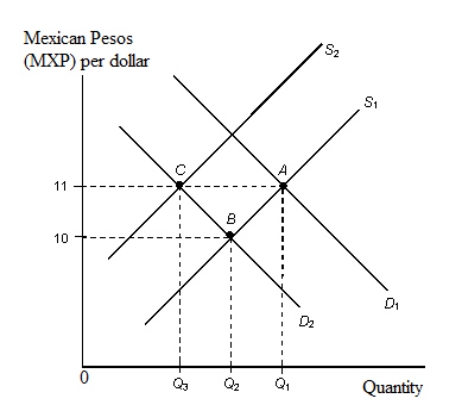 Refer to Figure 13.2.Given a target exchange rate of MXP 11 = $1 with S1 the relevant supply curve and a decline in Mexican demand for U.S.dollars from D1 to D2 the Fed intervenes in the foreign exchange market by:
A) selling Q3 amount of pesos.
B) selling Q3 amount of U.S.dollars.
C) buying (Q2 - Q1) amount of pesos.
D) buying (Q1 - Q3) amount of U.S.dollars.
E) buying (Q2 - Q3) amount of U.S dollars.
Correct Answer:
Verified
Q57: The table given below shows the assets
Q58: Which of the following is the latest
Q59: If the FOMC purchases government bonds priced
Unlock this Answer For Free Now!
View this answer and more for free by performing one of the following actions

Scan the QR code to install the App and get 2 free unlocks

Unlock quizzes for free by uploading documents