The figure given below shows the demand and supply curves of steel.Sp is the private supply curve, and Ss is the social supply curve that includes both private costs and external costs. Figure 13.2 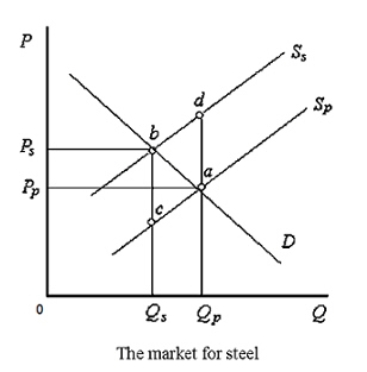 According to Figure 13.2:
A) both points a and b are socially efficient.
B) both points a and b are inefficient.
C) point a represents the social equilibrium, whereas point b represents the private equilibrium.
D) point a represents the private equilibrium, whereas point b represents the social equilibrium.
E) when external costs are zero, the socially efficient output level is equal to 0Qs units.
Correct Answer:
Verified
Q41: The figure given below shows the demand
Q50: The figure below shows the demand and
Q53: If education has positive externalities:
A)the private market
Q55: Which of the following is a measure
Q56: Which of the following is an example
Q56: The figure given below shows the demand
Q57: The figure below shows the demand and
Q58: The figure given below shows the demand
Q59: The figure given below shows the demand
Q60: The figure given below shows the demand
Unlock this Answer For Free Now!
View this answer and more for free by performing one of the following actions

Scan the QR code to install the App and get 2 free unlocks

Unlock quizzes for free by uploading documents