The figure given below shows the demand for permits and the maximum permissible level of pollution. Figure 13.4 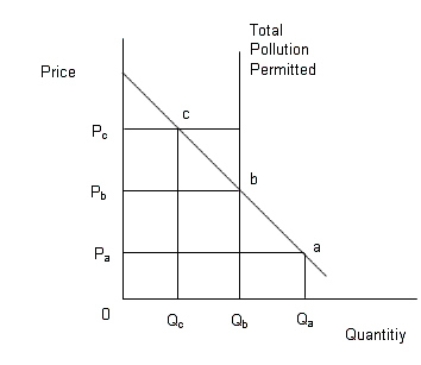 In the figure,
The downward sloping line is the demand curve of permits;
The vertical line denotes the maximum permissible limit of pollution.
In Figure 13.4, if the government sells Qb permits to pollute at a price of Pb each, then:
A) the allocation of pollution reduction is inefficient.
B) firms in the market will be forced to shut down due to excessive government regulation.
C) the allocation of pollution reduction is efficient, because only those firms with a marginal cost of pollution reduction greater than Pb will buy the permits.
D) the allocation of pollution reduction is efficient, because only those firms with a marginal cost of pollution reduction less than Pb will buy the permits.
E) the allocation of pollution reduction is inefficient, because only those firms with the lowest costs of pollution reduction will purchase the permits.
Correct Answer:
Verified
Q27: In China prior to 1990,most residential buildings
Q33: The following table shows the costs and
Q37: The following table shows the costs and
Q38: The following table shows the costs and
Q40: The table below shows the payoff (profit)
Q45: When the government tries to control pollution
Q46: The Clean Air Act of 1972 required
Q54: The European Union Emission Trading Scheme is
Q58: The figure given below shows the demand
Q60: When the government imposes a tax on
Unlock this Answer For Free Now!
View this answer and more for free by performing one of the following actions

Scan the QR code to install the App and get 2 free unlocks

Unlock quizzes for free by uploading documents