In the following figure, the first panel shows a market situation prior to regulation and the second panel shows the effects of regulation. Figure 12.2 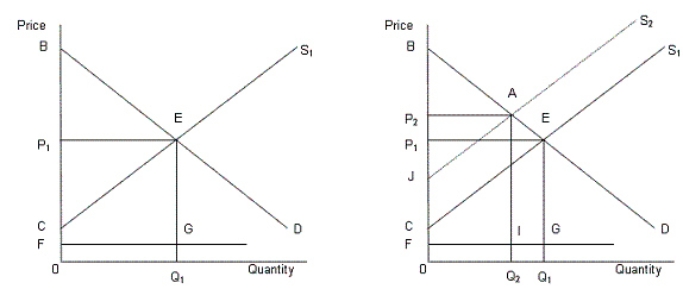 In the figure,
D: Demand curve for automobiles
S1: Supply curve of automobiles prior to regulation
S2: Supply curve of automobiles after regulation
FG: Clean up cost per unit
What is the total societal surplus prior to regulation described in Figure 12.2?
A) Area 0FGQ1.
B) Area BEP1.
C) Area CEP1.
D) Area FGEP1.
E) Area BEC.
Correct Answer:
Verified
Q29: Most natural monopolies are regulated at some
Q40: The figure below shows revenue and cost
Q40: Q41: The argument made in favor of privatization Q43: If social regulation increases a firm's fixed Q47: In the following figure, the first panel Q52: When regulating a natural monopoly,government officials face Q56: An example of the opportunity costs involved Q56: In the following figure, the first panel Q57: The figure below shows revenue and cost![]()
Unlock this Answer For Free Now!
View this answer and more for free by performing one of the following actions

Scan the QR code to install the App and get 2 free unlocks

Unlock quizzes for free by uploading documents