In the following figure, the first panel shows a market situation prior to regulation and the second panel shows the effects of regulation. Figure 12.2 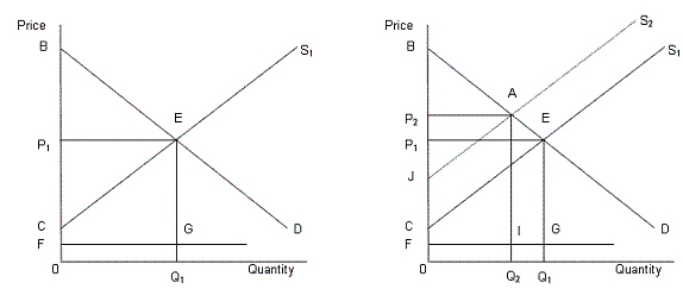 In the figure,
D: Demand curve for automobiles
S1: Supply curve of automobiles prior to regulation
S2: Supply curve of automobiles after regulation
FG: Clean up cost per unit
According to Figure 12.2, the total clean up cost after the regulation is:
A) area 0FIQ2.
B) area 0FGQ1.
C) area BEC.
D) area BEP1.
E) area BEGF.
Correct Answer:
Verified
Q42: Graphically,consumer surplus is the area:
A)above the demand
Q45: Which of the following factors helps to
Q48: Why was trucking deregulated in the U.S.in
Q54: In the following figure, the first panel
Q54: Why do the regulated companies oppose deregulation?
A)They
Q55: If a market becomes deregulated and is
Q68: In the following figure, the first panel
Q71: In the following figure, the first panel
Q72: In the following figure, the first panel
Q77: Which of the following is true ofthe
Unlock this Answer For Free Now!
View this answer and more for free by performing one of the following actions

Scan the QR code to install the App and get 2 free unlocks

Unlock quizzes for free by uploading documents