The figure given below shows the revenue and cost curves of a monopolistically competitive firm. Figure: 11.3 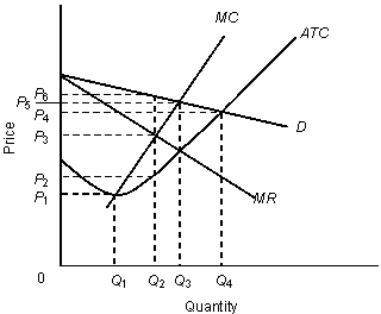 In the figure,
D: Demand curve
MR: Marginal revenue curve
MC: Marginal cost curve
ATC: Average total cost curve
The profit per unit of output for the firm in the Figure 11.3 is:
A) P5 - P3.
B) P6 - P3.
C) P3 - P2.
D) P6 - P2.
E) P4 - P2.
Correct Answer:
Verified
Q22: Advertising,brand names,packaging,and celebrity endorsements all occur in
Q23: The figure given below shows the revenue
Q26: The figure below shows the revenue and
Q27: The figure given below shows the revenue
Q27: The figure given below shows the revenue
Q33: The figure given below shows the revenue
Q34: The figure given below shows the revenue
Q35: The figure given below shows the revenue
Q58: Martin is in the market for a
Q59: The figure given below shows the revenue
Unlock this Answer For Free Now!
View this answer and more for free by performing one of the following actions

Scan the QR code to install the App and get 2 free unlocks

Unlock quizzes for free by uploading documents