The table below shows the payoff (profit) matrix of Firm A and Firm B indicating the profit outcome that corresponds to each firm's pricing strategy (where $500 and $200 are the pricing strategies of two firms) . Table 11.2 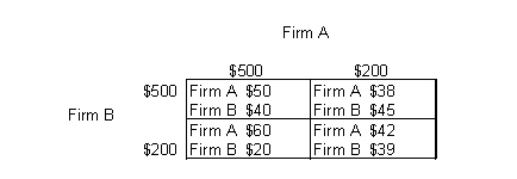 Refer to Table 11.2.If firm B follows its dominant strategy but firm A does not, firm B will earn a profit of:
A) $45.
B) $40.
C) $20.
D) $60.
E) $50
Correct Answer:
Verified
Q42: The oligopoly market structure model is characterized
Q54: The figure given below shows the revenue
Q56: The figure given below shows the revenue
Q57: The following table shows the payoff matrix
Q59: The following table shows the payoff matrix
Q62: The table below shows the payoff (profit)
Q62: The firms in an oligopoly market structure
Q66: When firms use cost-plus pricing in a
Q69: When firms in an illegal market form
Q78: An efficient way to move toward the
Unlock this Answer For Free Now!
View this answer and more for free by performing one of the following actions

Scan the QR code to install the App and get 2 free unlocks

Unlock quizzes for free by uploading documents