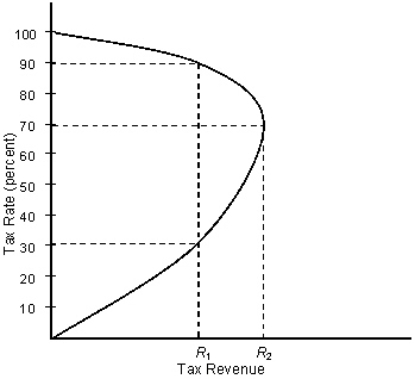
The figure given below depicts the tax revenue for different tax rates applied by the government. Figure 11.2  Refer to Figure 11.2.If the tax rate were 100 percent:
A) tax revenue would be maximized.
B) no one would be willing to work.
C) there would be a strong incentive to work.
D) tax revenue would be greater than if the tax rate were zero percent.
E) tax revenue would be less than if the tax rate were zero percent.
Correct Answer:
Verified
Q4: If aggregate demand intersects aggregate supply in
Q5: Ceteris paribus, if the U.S.federal government reduces
Q6: The effect of an increase in government
Q7: Which of the following is not a
Q8: If the government wants to close a
Q10: If government spending in a country declines
Q11: Government spending equals the sum of _,
Q12: Which of the following statements about taxation
Q13: The _ is the difference between potential
Q14: The figure given below depicts the tax
Unlock this Answer For Free Now!
View this answer and more for free by performing one of the following actions

Scan the QR code to install the App and get 2 free unlocks

Unlock quizzes for free by uploading documents