The figure given below depicts the tax revenue for different tax rates applied by the government. Figure 11.2 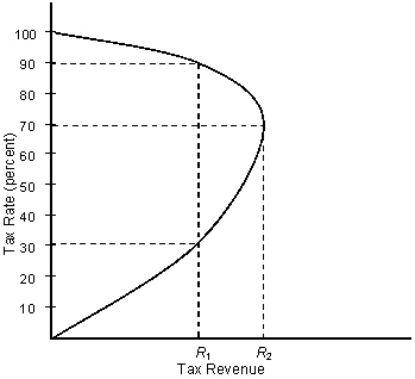 Which of the following is depicted in Figure 11.2?
A) The Lorenz curve
B) The community indifference curve
C) The aggregate labor supply curve
D) The Laffer curve
E) The Engel curve
Correct Answer:
Verified
Q25: If fewer businesses offer new bonds to
Q26: The emphasis on the greater incentives to
Q27: If consumers spend _ of a change
Q28: Discretionary fiscal policy is bestdefined as:
A)the deliberate
Q29: Which of the following correctly explain Ricardian
Q31: Ricardian equivalencecan be said to hold if:
A)taxation
Q32: If crowding out exists, the expansionary effect
Q33: The figure given below depicts the macroeconomic
Q34: In the late 1990s, debt-financed government spending
Q35: Identify the correct statement.
A)It is absolutely compulsory
Unlock this Answer For Free Now!
View this answer and more for free by performing one of the following actions

Scan the QR code to install the App and get 2 free unlocks

Unlock quizzes for free by uploading documents