The figure given below shows the demand curve faced by a firm. Figure 10.1 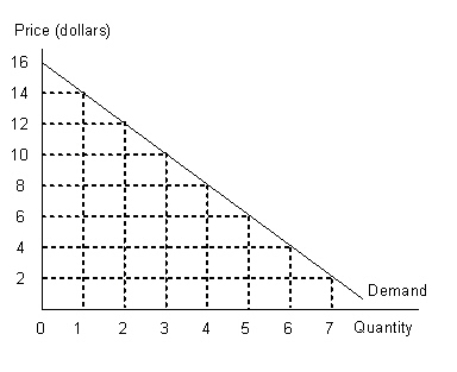 Refer to Figure 10.1 and calculate the revenue lost when the firm lowers the price of its product from $8 to $4.
A) $20
B) $18
C) $24
D) $16
E) $28
Correct Answer:
Verified
Q23: The figures given below represent the revenue
Q25: The figures given below represent the revenue
Q27: The table given below shows the price
Q28: The figures given below represent the revenue
Q29: The following table shows the units of
Q31: The figures given below represent the revenue
Q32: The table given below shows the prices
Q33: The table given below shows the prices
Q34: The figure given below shows the demand
Q35: The table given below shows the price
Unlock this Answer For Free Now!
View this answer and more for free by performing one of the following actions

Scan the QR code to install the App and get 2 free unlocks

Unlock quizzes for free by uploading documents