The following figure shows the revenue and cost curves of a monopolist. Figure 10.3 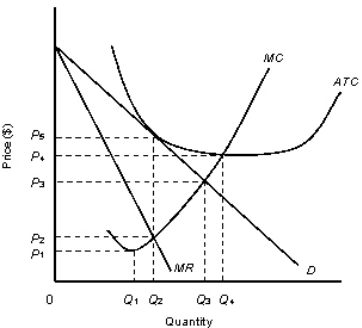 D: Average Revenue
MR: Marginal Revenue
ATC: Average Total Cost
MC: marginal Cost
Consider the monopolist described in Figure 10.3.The firm can maximize profit by producing:
A) zero units.
B) Q1 units.
C) Q2 units.
D) Q3 units.
E) Q4 units.
Correct Answer:
Verified
Q29: The table given below shows the prices
Q34: If a monopolist is producing at a
Q37: The table given below shows the price
Q38: The figures given below represent the revenue
Q38: The following table shows the units of
Q42: The table given below shows the price,
Q44: The following table shows the marginal revenues
Q44: The table given below shows the price,
Q49: The table given below shows the price,
Q53: Which of the following is not a
Unlock this Answer For Free Now!
View this answer and more for free by performing one of the following actions

Scan the QR code to install the App and get 2 free unlocks

Unlock quizzes for free by uploading documents