The figure below shows the market equilibrium (point B) at the intersection of demand and supply curves under perfect competition. Figure 10.5 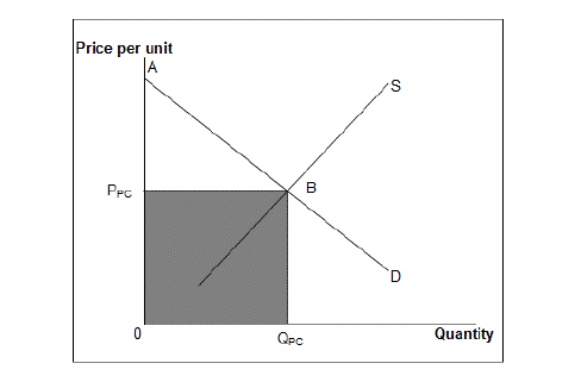 D: Market demand curve
S: Market supply curve
Refer to Figure 10.5.Which of the following regions on the graph represents consumer surplus in a perfectly competitive market?
A) The area PPCBA
B) The area 0BPPC
C) The area 0BA
D) Half of area PPCBA
E) The area ABS
Correct Answer:
Verified
Q47: To practice price discrimination,a firm:
A)must be facing
Q62: The figure below shows the market equilibrium
Q64: The following figures show the demand and
Q64: Movie theaters are able to offer discounts
Q65: Perfect price discrimination occurs when:
A)each customer is
Q66: The following figures show the demand and
Q67: The figure below shows the market equilibrium
Q68: The following figure shows the revenue curves
Q69: The following table shows the marginal revenues
Q73: Compared with a perfectly competitive market with
Unlock this Answer For Free Now!
View this answer and more for free by performing one of the following actions

Scan the QR code to install the App and get 2 free unlocks

Unlock quizzes for free by uploading documents