The figure below shows the market equilibrium (point B) at the intersection of demand and supply curves under perfect competition. Figure 10.5 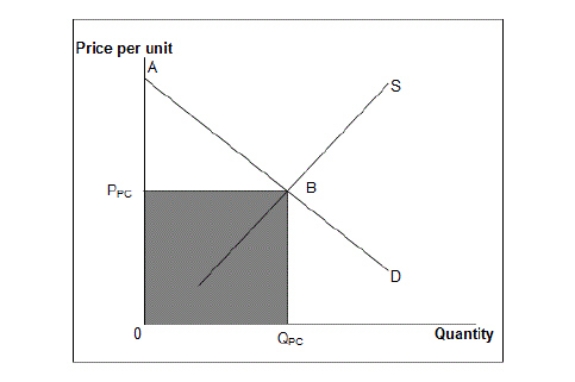 D: Market demand curve
S: Market supply curve
Assume that in Figure 10.5, the market is originally perfectly competitive but then becomes a monopoly.Compared with perfect competition, a monopoly would have:
A) a price lower than PPC.
B) a quantity more than QPC.
C) a greater consumer surplus.
D) a deadweight loss.
E) a lower producer surplus.
Correct Answer:
Verified
Q46: If at the profit-maximizing level of output,a
Q47: To practice price discrimination,a firm:
A)must be facing
Q54: The table given below shows the prices
Q59: A monopolist can charge a high price
Q64: The following figures show the demand and
Q65: The figure below shows the market equilibrium
Q66: The following figures show the demand and
Q67: The figure below shows the market equilibrium
Q69: The following table shows the marginal revenues
Q73: Compared with a perfectly competitive market with
Unlock this Answer For Free Now!
View this answer and more for free by performing one of the following actions

Scan the QR code to install the App and get 2 free unlocks

Unlock quizzes for free by uploading documents