The following figure shows revenue and cost curves of a monopolist. Figure 10.8 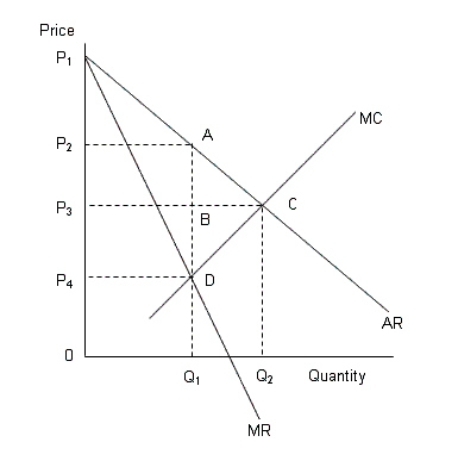 AR: Average revenue curve
MR: Marginal revenue curve
MC: Marginal cost curve
According to Figure 10.7, the profit maximizing price of the monopolist is:
A) 0.
B) P4.
C) P3.
D) P2.
E) P1.
Correct Answer:
Verified
Q81: The figure given below shows the cost
Q83: The figure given below shows the cost
Q84: The figure given below shows the cost
Q88: The figure given below shows the cost
Q90: The figure given below shows the cost
Q91: The following figure shows revenue and cost
Q94: The figure given below shows the cost
Q95: The figure given below shows the cost
Q100: The figure given below shows the cost
Q109: The figure given below shows the cost
Unlock this Answer For Free Now!
View this answer and more for free by performing one of the following actions

Scan the QR code to install the App and get 2 free unlocks

Unlock quizzes for free by uploading documents