The figure given below represents the leakages and injections in an economy. Figure 10.2 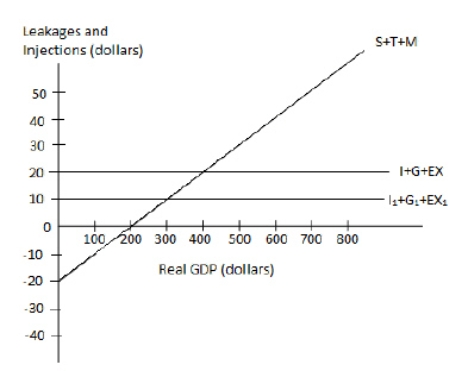 In the figure:
I, I1: Investment;
G: Government spending;
EX, EX1: Exports;
T: Taxes;and
M: Imports.
Refer to Figure 10.2.When total injections equal $20, the equilibrium level of real GDP is:
A) $100.
B) $200.
C) $300.
D) $400.
E) $500.
Correct Answer:
Verified
Q4: The table given below states the value
Q5: At the equilibrium level of income, which
Q6: The table given below states the value
Q7: Assume we are at an income level
Q8: The equilibrium level of income will rise
Q10: The figure given below shows the aggregate
Q11: Which of the following can be considered
Q12: The figure given below shows the aggregate
Q13: The table given below states the value
Q14: In macroeconomics, equilibrium is defined as the
Unlock this Answer For Free Now!
View this answer and more for free by performing one of the following actions

Scan the QR code to install the App and get 2 free unlocks

Unlock quizzes for free by uploading documents