The figure given below represents the macroeconomic equilibrium in the aggregate income and aggregate expenditure framework.Assume that MPI is equal to zero. Figure 10.4 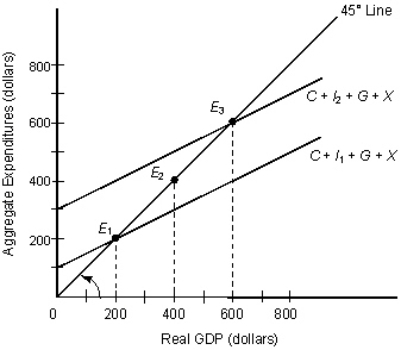 In the figure:
C: Consumption
I1 and I2: Investment
G: Government Spending
X: Exports
Refer to Figure 10.4.Compute the increase in investment spending from I1 to I2.
A) $600.
B) $100.
C) $200.
D) $400.
E) $300.
Correct Answer:
Verified
Q45: The table given below reports the value
Q46: What is the value of the spending
Q47: The table given below reports the value
Q48: The table given below reports the value
Q49: In a closed economy that does not
Q51: The table given below reports the value
Q52: Scenario 10.2 A hypothetical open economy has
Q53: If MPS is equal to 0.15 and
Q54: Suppose equilibrium income decreases by $600 as
Q55: Consider a closed economy described by AE
Unlock this Answer For Free Now!
View this answer and more for free by performing one of the following actions

Scan the QR code to install the App and get 2 free unlocks

Unlock quizzes for free by uploading documents