The figure given below shows the macroeconomic equilibrium of a country. Figure 10.7 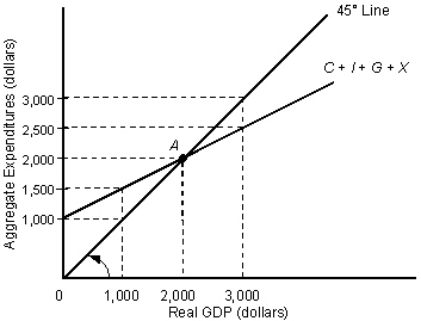 Given a potential GDP level of $3, 000, the recessionary gap in Figure 10.7 equals _____.
A) $3, 000
B) $2, 500
C) $1, 500
D) $500
E) $100
Correct Answer:
Verified
Q58: If equilibrium income is $500 billion, MPC
Q59: In an economy that has no foreign
Q60: Consider an economy that is in equilibrium
Q61: Assume that potential GDP is $200 billion
Q62: The figure given below depicts macroeconomic equilibrium
Q64: The table given below shows the real
Q65: The figure given below represents the macroeconomic
Q66: The table given below shows the real
Q67: The table given below shows the real
Q68: The figure given below represents the macroeconomic
Unlock this Answer For Free Now!
View this answer and more for free by performing one of the following actions

Scan the QR code to install the App and get 2 free unlocks

Unlock quizzes for free by uploading documents