The following graph shows the marginal revenue (MR) and marginal cost (MC) curves of an imperfectly competitive firm. Figure 8.2 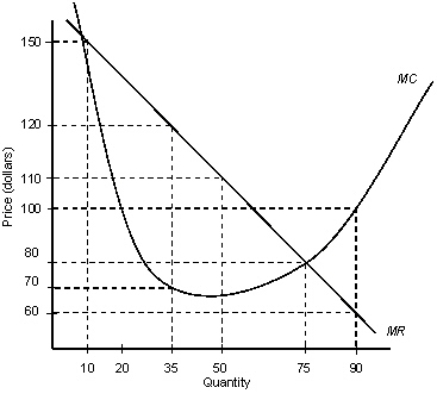 According to Figure 8.2, the firm is maximizing profit at a quantity of _____ units.
A) 10
B) 35
C) 50
D) 75
E) 90
Correct Answer:
Verified
Q21: The addition to a business firm's total
Q23: A firm enjoys a positive economic profit
Q32: The table given below reports the marginal
Q37: The following graph shows the marginal revenue
Q39: The table given below reports the marginal
Q43: Monopoly is a market structure in which:
A)there
Q45: The figure given below shows the revenue
Q53: A(n) _ is a price taker.
A)monopolistic firm.
B)oligopoly
Q55: If barriers to entry exist in a
Q59: The only decision that a perfectly competitive
Unlock this Answer For Free Now!
View this answer and more for free by performing one of the following actions

Scan the QR code to install the App and get 2 free unlocks

Unlock quizzes for free by uploading documents