The following figure shows the cost and revenue structures of a firm.MC represents the marginal cost curve, AC represents the average cost curve, AR represents the average revenue curve, and MR represents the marginal revenue curve.P* is the equilibrium price and Q* is the equilibrium output. Figure 8.5 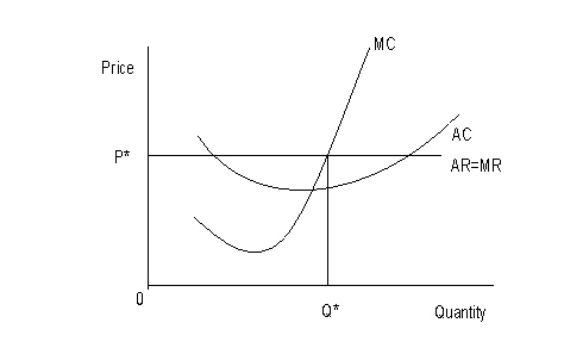 Refer to Figure 8.5.Identify the market structure in which the firm operates:
A) Perfect competition
B) Monopolistic competition
C) Monopoly
D) Oligopoly
E) Duopoly
Correct Answer:
Verified
Q61: Scenario 8.1
Jane left her job at
Q65: The following figure shows the cost and
Q70: The following figure shows the cost and
Q74: Scenario 9.1
Jane left her job at Siemens
Q75: In contrast to both perfect competition and
Q75: The figure given below shows the revenue
Q76: Accounting profit of a business firm is
Q77: A monopolist faces the least price elastic
Q78: The characteristic that distinguishes a perfectly competitive
Q79: The figure given below shows the revenue
Unlock this Answer For Free Now!
View this answer and more for free by performing one of the following actions

Scan the QR code to install the App and get 2 free unlocks

Unlock quizzes for free by uploading documents