The figure given below represents the long-run equilibrium in the aggregate demand and aggregate supply model. Figure 8.2 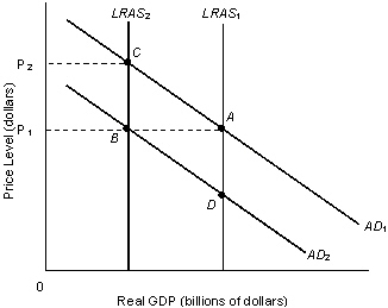 Refer to Figure 8.2.The combination of rising prices and falling output is known as stagflation.This phenomenon is represented by which of the following shifts?
A)  to
to
B)  to
to
C)  to
to
D)  to
to
E) The combination of  to
to and
and to
to
Correct Answer:
Verified
Q69: Aggregate demand-aggregate supply analysis shows that in
Q70: Suppose in Country X, wages of workers
Q71: A simultaneous increase in inflation and decrease
Q72: The degree to which _ declines during
Q73: Other things equal, an increase in aggregate
Q75: A simultaneous increase in both unemployment and
Q76: Other things equal, an increase in aggregate
Q77: The intersection of the aggregate demand and
Q78: In the 1970s the international price of
Q79: Which of the following is true of
Unlock this Answer For Free Now!
View this answer and more for free by performing one of the following actions

Scan the QR code to install the App and get 2 free unlocks

Unlock quizzes for free by uploading documents