The figure given below represents the equilibrium real GDP and price level in the aggregate demand and aggregate supply model. Figure 8.3 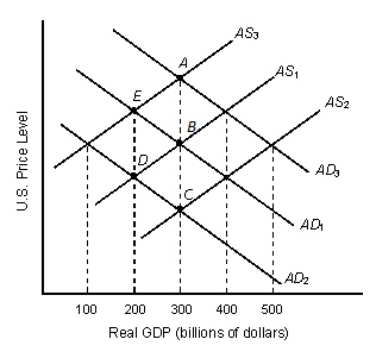 In Figure 8.3, which of the following shifts would result in stagflation (economic stagnation and inflation) ?
A) AS1 to AS2
B) AD1 to AD2
C) AD2 to AD1
D) AD2 toAD3
E) AS1 to AS3
Correct Answer:
Verified
Q94: If there is a sudden jump in
Q95: The figure given below represents the equilibrium
Q96: A decrease in the relative price of
Q97: The figure given below represents the equilibrium
Q98: A lower domestic price level raises aggregate
Q100: In 2009, a nation reported total imports
Q101: If people expect the economy to do
Q102: In the long-run, the aggregate supply curve
Q103: The aggregate quantity of goods and services
Q104: If the level of prices falls, the
Unlock this Answer For Free Now!
View this answer and more for free by performing one of the following actions

Scan the QR code to install the App and get 2 free unlocks

Unlock quizzes for free by uploading documents