The figure given below shows cost curves of a firm. Figure: 7.2 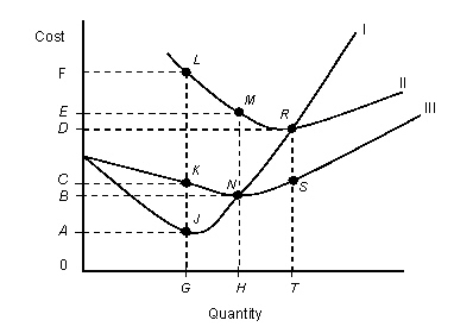 In the figure,
|: Marginal cost curve
||: Average total cost curve
|||: Average variable cost curve
Refer to Figure 7.2.At an output level of H, total fixed cost is:
A) SR.
B) LK.
C) BE.
D) area BEMN.
E) area 0EMH.
Correct Answer:
Verified
Q21: Assume that one laborer produces 6 units
Q23: The figure given below shows cost curves
Q23: Suppose that for 20 bicycles,the total fixed
Q24: The table below shows the total cost
Q26: The figure given below shows cost curves
Q32: Which of the following is not correct?
A)If
Q32: The table below shows the total cost
Q36: The following table shows the cost of
Q38: With expansion in the level of output,total
Q39: For a steel manufacturing firm,overhead costs would
Unlock this Answer For Free Now!
View this answer and more for free by performing one of the following actions

Scan the QR code to install the App and get 2 free unlocks

Unlock quizzes for free by uploading documents