The figure given below shows three Short Run Average Total Cost (SRATC) curves and the Long Run Average Total Cost (LRATC) curve of a firm. Figure 7.3 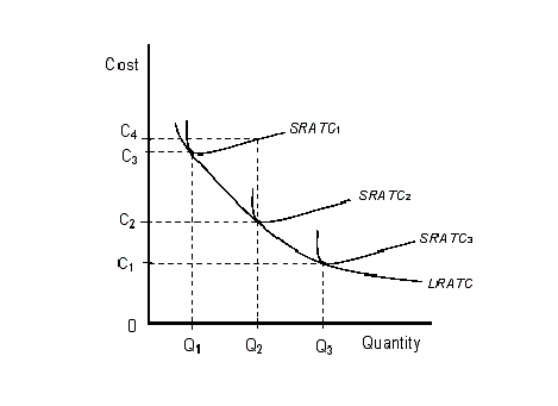 Refer to the Figure 7.3.In the long run, an increase in production from Q1 to Q3 would:
A) increase average cost by C4 - C1.
B) increase average cost by C3 - C1.
C) increase average cost by C3 - C2.
D) decrease average cost by C3 - C1.
E) decrease average cost by C3 - C2.
Correct Answer:
Verified
Q62: If long-run costs are plotted on the
Q65: The figure given below shows three Short
Q65: The term minimum efficient scale means:
A)the output
Q67: The table given below shows the average
Q70: The figure given below shows three Short
Q71: The figure given below shows three Short
Q77: The figure given below shows three Short
Q77: The long-run average-total- cost curve represents:
A)the maximum
Q78: If a company is producing at a
Q79: Which of the following is not a
Unlock this Answer For Free Now!
View this answer and more for free by performing one of the following actions

Scan the QR code to install the App and get 2 free unlocks

Unlock quizzes for free by uploading documents