The below figure shows the demand and supply of DVD rentals in a city.S1 and D1 are the
Original supply and demand curves.The demand curve shifts from D1 to D2.
Figure 3.4 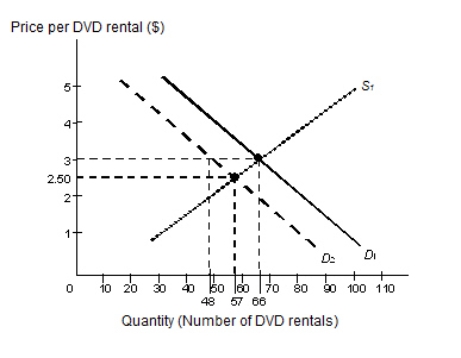 Refer to Figure 3.4 and identify the true statement.
A) The supply of DVD rentals has decreased.
B) The original equilibrium quantity was 57.
C) The new equilibrium price is $3.
D) The demand for DVD rentals has decreased.
E) The new equilibrium quantity is 48.
Correct Answer:
Verified
Q44: The figure given below shows the demand
Q47: Assume that Ford Motor Company engineers achieve
Q50: The figure given below represents the equilibrium
Q53: The table given below represents the supply
Q54: The table given below reports the quantity
Q56: The table given below reports the quantity
Q57: In the figure given below D1 and
Q58: In the figure given below, D1 and
Q59: The relationship between prices and the corresponding
Q60: The table given below reports the quantity
Unlock this Answer For Free Now!
View this answer and more for free by performing one of the following actions

Scan the QR code to install the App and get 2 free unlocks

Unlock quizzes for free by uploading documents