The figure given below represents the production possibilities curve for goods and services in an economy. Figure 2.3 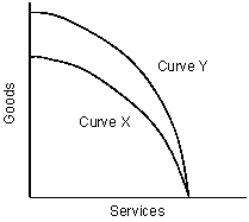 Refer to Figure 2.3.The movement from Curve X to Curve Y indicates:
A) contraction in the production of goods.
B) contraction in the production of services.
C) expansion in the ability to produce both goods and services.
D) expansion in the ability to produce goods.
E) expansion in the ability to produce services.
Correct Answer:
Verified
Q6: Figure 1.3 Q7: Following is the production possibilities schedule for Q13: Which of the following conditions will be Q19: Figure 1.3 Q21: Given below is the production possibilities schedule Q24: The figure given below represents an economy Q25: Given below is the production possibilities schedule Q26: Given below is the production possibilities schedule Q27: Given below is the production possibilities schedule Q36: Which of the following ideas is illustrated
![]()
![]()
Unlock this Answer For Free Now!
View this answer and more for free by performing one of the following actions

Scan the QR code to install the App and get 2 free unlocks

Unlock quizzes for free by uploading documents