Figure 8-20
On the vertical axis of each graph, DWL is deadweight loss.
-Refer to Figure 8-20. Which graph correctly illustrates the relationship between the size of a tax and the size of the deadweight loss associated with the tax? 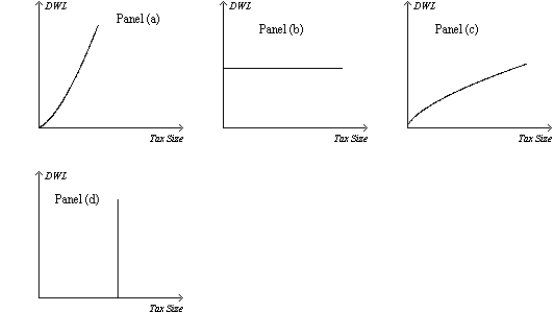
A) Panel a)
B) Panel b)
C) Panel c)
D) Panel d)
Correct Answer:
Verified
Q22: Which of the following scenarios is consistent
Q23: The view held by Arthur Laffer and
Q38: Which of the following scenarios is not
Q41: As the size of a tax rises,the
Q50: Figure 8-22 Q54: Which of the following would likely have Q55: Figure 8-22 Q59: Which of the following statements is correct? Q60: Figure 8-21 Q201: Suppose the federal government doubles the gasoline Unlock this Answer For Free Now! View this answer and more for free by performing one of the following actions Scan the QR code to install the App and get 2 free unlocks Unlock quizzes for free by uploading documents![]()
![]()
A)A![]()

