Essay
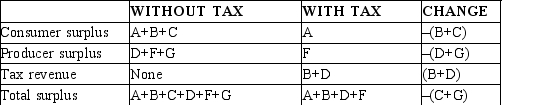
Use the following graph shown to fill in the table that follows. 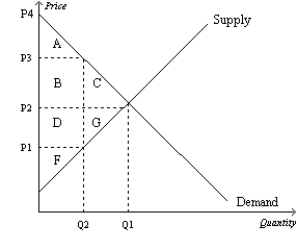

Correct Answer:
Verified
Related Questions
Q18: Figure 8-25 Q19: Figure 8-25 Q44: Economists dismiss the idea that lower tax Q46: The result of the large tax cuts Q49: The idea that tax cuts would increase Q51: The more elastic are supply and demand Q53: Suppose that a university charges students a Q54: Economist Arthur Laffer made the argument that Q59: The optimal tax is difficult to determine Q68: Scenario 8-3![]()
![]()
Suppose the market demand and market
Unlock this Answer For Free Now!
View this answer and more for free by performing one of the following actions

Scan the QR code to install the App and get 2 free unlocks

Unlock quizzes for free by uploading documents