Figure 26-1.The figure depicts a demand-for-loanable-funds curve and two supply-of-loanable-funds curves. 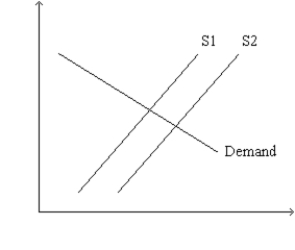
-Refer to Figure 26-1.Which of the following events would shift the supply curve from S1 to S2?
A) In response to tax reform,firms are encouraged to invest more than they previously invested.
B) In response to tax reform,households are encouraged to save more than they previously saved.
C) Government goes from running a balanced budget to running a budget deficit.
D) Any of the above events would shift the supply curve from S1 to S2.
Correct Answer:
Verified
Q102: Figure 26-2.The figure depicts a supply-of-loanable-funds curve
Q103: Figure 26-4.On the horizontal axis of the
Q104: If the budget deficit increases then
A)saving and
Q105: Figure 26-3.The figure shows two demand-for-loanable-funds curves
Q106: Figure 26-3.The figure shows two demand-for-loanable-funds curves
Q108: Figure 26-3.The figure shows two demand-for-loanable-funds curves
Q109: Figure 26-4.On the horizontal axis of the
Q110: Figure 26-2.The figure depicts a supply-of-loanable-funds curve
Q111: Figure 26-4.On the horizontal axis of the
Q112: Figure 26-4.On the horizontal axis of the
Unlock this Answer For Free Now!
View this answer and more for free by performing one of the following actions

Scan the QR code to install the App and get 2 free unlocks

Unlock quizzes for free by uploading documents