Figure 26-3.The figure shows two demand-for-loanable-funds curves and two supply-of-loanable-funds curves. 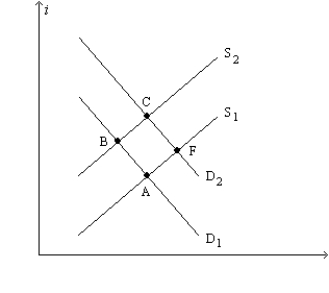
-Refer to Figure 26-3.What,specifically,does the label on the vertical axis,i,represent?
A) the nominal interest rate
B) the real interest rate
C) the inflation rate
D) the dividend yield
Correct Answer:
Verified
Q100: Which of the following is correct?
A)In a
Q101: Figure 26-3.The figure shows two demand-for-loanable-funds curves
Q102: Figure 26-2.The figure depicts a supply-of-loanable-funds curve
Q103: Figure 26-4.On the horizontal axis of the
Q104: If the budget deficit increases then
A)saving and
Q106: Figure 26-3.The figure shows two demand-for-loanable-funds curves
Q107: Figure 26-1.The figure depicts a demand-for-loanable-funds curve
Q108: Figure 26-3.The figure shows two demand-for-loanable-funds curves
Q109: Figure 26-4.On the horizontal axis of the
Q110: Figure 26-2.The figure depicts a supply-of-loanable-funds curve
Unlock this Answer For Free Now!
View this answer and more for free by performing one of the following actions

Scan the QR code to install the App and get 2 free unlocks

Unlock quizzes for free by uploading documents