Figure 26-3. The figure shows two demand-for-loanable-funds curves and two supply-of-loanable-funds curves. 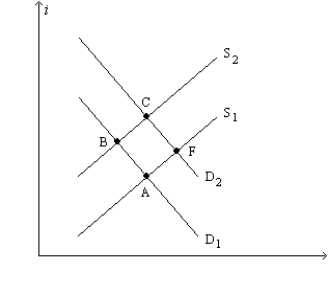
-Refer to Figure 26-3. A shift of the demand curve from D1 to D2 is called
A) an increase in the demand for loanable funds, and that increase would originate from people who had some extra income they wanted to lend.
B) an increase in the demand for loanable funds, and that increase would originate from households and firms who wish to borrow to make investments.
C) a decrease in the demand for loanable funds, and that decrease would originate from people who had some extra income they wanted to lend.
D) a decrease in the demand for loanable funds, and that decrease would originate from households and firms who wish to borrow to make investments.
Correct Answer:
Verified
Q84: The ratio of debt to GDP in
Q85: A policy that induces people to save
Q94: If the government instituted an investment tax
Q95: According to the loanable funds model,which of
Q98: Which of the following is included in
Q117: Figure 26-1.The figure depicts a demand-for-loanable-funds curve
Q120: For an imaginary economy,when the real interest
Q128: When the government goes from running a
Q140: As real interest rates fall,firms desire to
A)buy
Q403: Figure 26-4. On the horizontal axis of
Unlock this Answer For Free Now!
View this answer and more for free by performing one of the following actions

Scan the QR code to install the App and get 2 free unlocks

Unlock quizzes for free by uploading documents