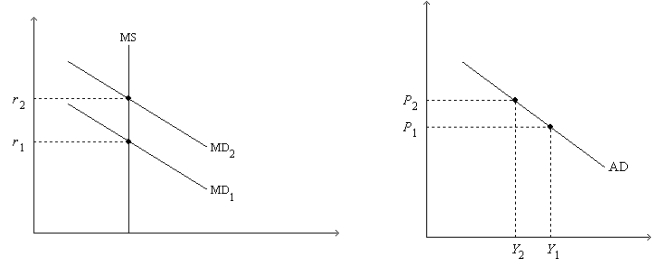
Figure 34-2. On the left-hand graph, MS represents the supply of money and MD represents the demand for money; on the right-hand graph, AD represents aggregate demand. The usual quantities are measured along the axes of both graphs.

-Refer to Figure 34-2. Assume the money market is always in equilibrium, and suppose r1 = 0.08; r2 = 0.12; Y1 = 13,000; Y2 = 10,000; P1 = 1.0; and P2 = 1.2. Which of the following statements is correct?
A) When r = r2, nominal output is higher than it is when r = r1.
B) When r = r2, real output is higher than it is when r = r1.
C) When r = r2, the expected rate of inflation is higher than it is when r = r1.
D) If the velocity of money is 4 when r = r2, then the quantity of money is $3,000.
Correct Answer:
Verified
Q44: Figure 34-1 Q47: Figure 34-2.On the left-hand graph,MS represents the Q55: When households decide to hold more money, Q59: Figure 34-1 Q62: Figure 34-3. Q64: Figure 34-2.On the left-hand graph,MS represents the Q68: Figure 34-3. Q77: Figure 34-2. On the left-hand graph, MS Q80: Figure 34-2. On the left-hand graph, MS Q81: Figure 34-3 Unlock this Answer For Free Now! View this answer and more for free by performing one of the following actions Scan the QR code to install the App and get 2 free unlocks Unlock quizzes for free by uploading documents![]()
A)interest![]()
![]()
![]()
![]()

