Figure 34-4. On the figure, MS represents money supply and MD represents money demand. 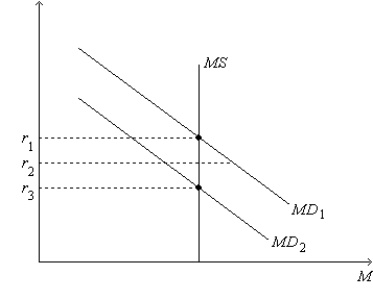
-Refer to Figure 34-4. Which of the following events could explain a shift of the money-demand curve from MD1 to MD2?
A) a decrease in the price level
B) a decrease in the cost of borrowing
C) an increase in the price level
D) an increase in the cost of borrowing
Correct Answer:
Verified
Q1: The marginal propensity to consume (MPC)is defined
Q166: Charisse is of the opinion that the
Q177: When the interest rate is below the
Q185: "Monetary policy can be described either in
Q186: Consider the following sequence of events:
Price level
Q193: Figure 34-4. On the figure, MS represents
Q194: Figure 34-4. On the figure, MS represents
Q194: In response to the sharp decline in
Q195: In response to the sharp decline in
Q198: Figure 34-4. On the figure, MS represents
Unlock this Answer For Free Now!
View this answer and more for free by performing one of the following actions

Scan the QR code to install the App and get 2 free unlocks

Unlock quizzes for free by uploading documents