Figure 34-5. On the figure, MS represents money supply and MD represents money demand. 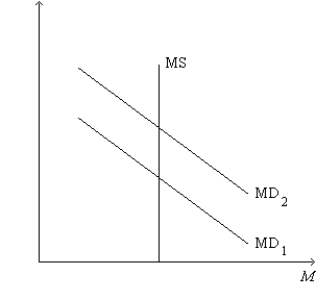
-Refer to Figure 34-5. A shift of the money-demand curve from MD1 to MD2 could be a result of
A) a decrease in taxes.
B) an increase in government spending.
C) an increase in the price level.
D) All of the above are correct.
Correct Answer:
Verified
Q16: Which of the following policy actions shifts
Q20: In a certain economy,when income is $400,consumer
Q22: An increase in government spending initially and
Q36: Suppose the multiplier has a value that
Q57: The change in aggregate demand that results
Q166: Scenario 34-1. Take the following information as
Q175: The government builds a new water-treatment plant.
Q237: Figure 34-5. On the figure, MS represents
Q239: Suppose an economy's marginal propensity to consume
Q244: Figure 34-6. On the left-hand graph, MS
Unlock this Answer For Free Now!
View this answer and more for free by performing one of the following actions

Scan the QR code to install the App and get 2 free unlocks

Unlock quizzes for free by uploading documents