Multiple Choice
Which of the following diagrams represents a Laffer curve?
A) 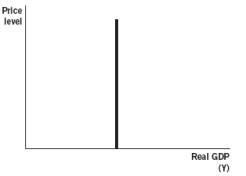
B) 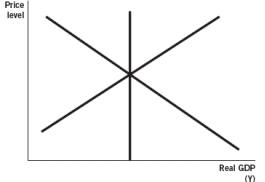
C) 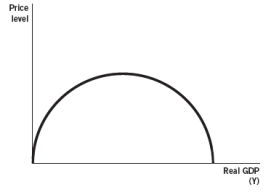
D) 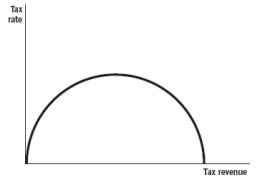
E) 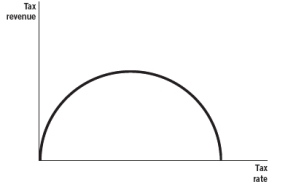
Correct Answer:
Verified
Related Questions
Q12: Income tax revenue is calculated by:
A) tax
Q103: In 1962,the marginal tax rates were as
Q105: At _ tax rates,_ in those tax
Q107: Supply-side fiscal policy initiatives take a long
Q111: A marginal tax rate of 91% means
Q114: One argument for tax cuts when the
Q115: The Laffer curve shows that
A) tax revenue
Q119: At _ tax rates,_ in those tax
Q120: An illustration of the relationship between tax
Q120: The y axis for the Laffer curve
Unlock this Answer For Free Now!
View this answer and more for free by performing one of the following actions

Scan the QR code to install the App and get 2 free unlocks

Unlock quizzes for free by uploading documents