Use the following graph to answer the next seven questions. The graph depicts an economy where aggregate demand and long-run aggregate supply (LRAS) have decreased, with no change in short-run aggregate supply (SRAS) .
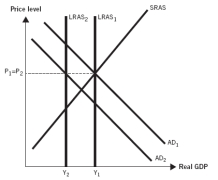
-During the Great Recession,real gross domestic product (GDP) fell yet the price level was largely unchanged,as depicted in the graph.Because of this,we know that:
A) both aggregate demand and long-run aggregate supply increased during the recession.
B) aggregate demand and long-run aggregate supply both decreased during the recession.
C) aggregate demand decreased and long-run aggregate supply increased during the recession.
D) aggregate demand decreased and short-run aggregate supply increased during the recession.
E) long-run aggregate supply increased and short-run aggregate supply decreased during the recession.
Correct Answer:
Verified
Q22: When U.S.aggregate demand and long-run aggregate supply
Q23: During the Great Recession,_ caused long-run aggregate
Q25: During the Great Recession,the U.S._ curve shifted
Q27: A decrease in U.S.housing prices would tend
Q28: During the Great Recession,the U.S.aggregate demand curve
Q29: During the Great Recession,long-run aggregate supply decreased.This
Q30: During the Great Recession,the U.S.long-run aggregate supply
Q32: During the Great Recession,_ caused aggregate demand
Q36: During the Great Recession,the U.S.aggregate demand curve
Q68: A decline in U.S.wealth would tend to
Unlock this Answer For Free Now!
View this answer and more for free by performing one of the following actions

Scan the QR code to install the App and get 2 free unlocks

Unlock quizzes for free by uploading documents