Use the following graph to answer the next six questions. This graph depicts an economy where aggregate demand has decreased, with no change in either short-run aggregate supply (SRAS) or long-run aggregate supply (LRAS) .
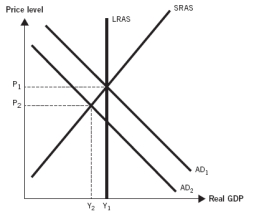
-During the Great Depression,the aggregate price level and real gross domestic product (GDP) both decreased,as depicted in the graph.Unemployment increased to record levels.Which of following best explains why this happened?
A) A sudden increase in oil prices caused inflation and a deep recession.
B) A stock market crash, large numbers of bank failures, an increase in tax rates, and a tight money supply caused a recession.
C) A rapid decline in housing prices led to problems in the loanable funds market and a recession.
D) A significant decline in military spending following the end of a war led to a recession.
E) A sharp recession followed the United States abandoning the gold standard.
Correct Answer:
Verified
Q42: When contrasted with other recessions,the Great Depression
A)
Q61: When the U.S.aggregate demand curve shifted to
Q62: Use the following graph to answer the
Q65: The Great Depression,when compared to other economic
Q70: Use the following graph to answer the
Q72: Use the following graph to answer the
Q73: During the Great Depression,the U.S.aggregate demand curve
Q76: The Great Depression lasted longer and was
Q77: During the Great Depression,the U.S.aggregate demand curve
Q140: When the U.S.aggregate demand curve shifted to
Unlock this Answer For Free Now!
View this answer and more for free by performing one of the following actions

Scan the QR code to install the App and get 2 free unlocks

Unlock quizzes for free by uploading documents