Refer to the following graph to answer the questions that follow.
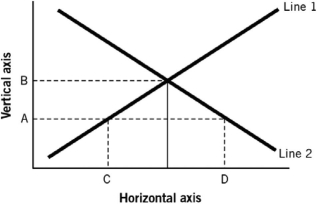
-Assuming the figure represents the market for loanable funds,and that point C represents 40 and point D represents 80,then it would be true that:
A) both points represent interest rates and there is a surplus of loanable funds at an 80% interest rate.
B) both points represent interest rates and there is a shortage of loanable funds at an 80% interest rate.
C) both points represent the quantity of loanable funds and there would be a surplus of loanable funds of 40 units.
D) both points represent the quantity of loanable funds and at interest rate A there would be a shortage of loanable funds of 40 units.
E) the quantity of loanable funds supplied exceeds the quantity demanded at interest rate B, if B represents an interest rate.
Correct Answer:
Verified
Q22: Refer to the following graph to answer
Q65: If foreign entities save more and businesses
Q67: If foreign entities save less and governments
Q103: The supply of loanable funds increases while
Q109: If household income rises and capital becomes
Q114: The demand for loanable funds increases while
Q116: The demand and supply of loanable funds
Q117: The demand for loanable funds increases while
Q119: The demand for loanable funds increases by
Q126: Which of the following reflects an accurate
Unlock this Answer For Free Now!
View this answer and more for free by performing one of the following actions

Scan the QR code to install the App and get 2 free unlocks

Unlock quizzes for free by uploading documents